
No install
About this video
On a new account, Scenario test opens with an editor and the classic strategies. The person starts from tradefloor's momentum bot, which holds the 3 stocks that rose most over the last 5 days, and changes one line so it holds 5.
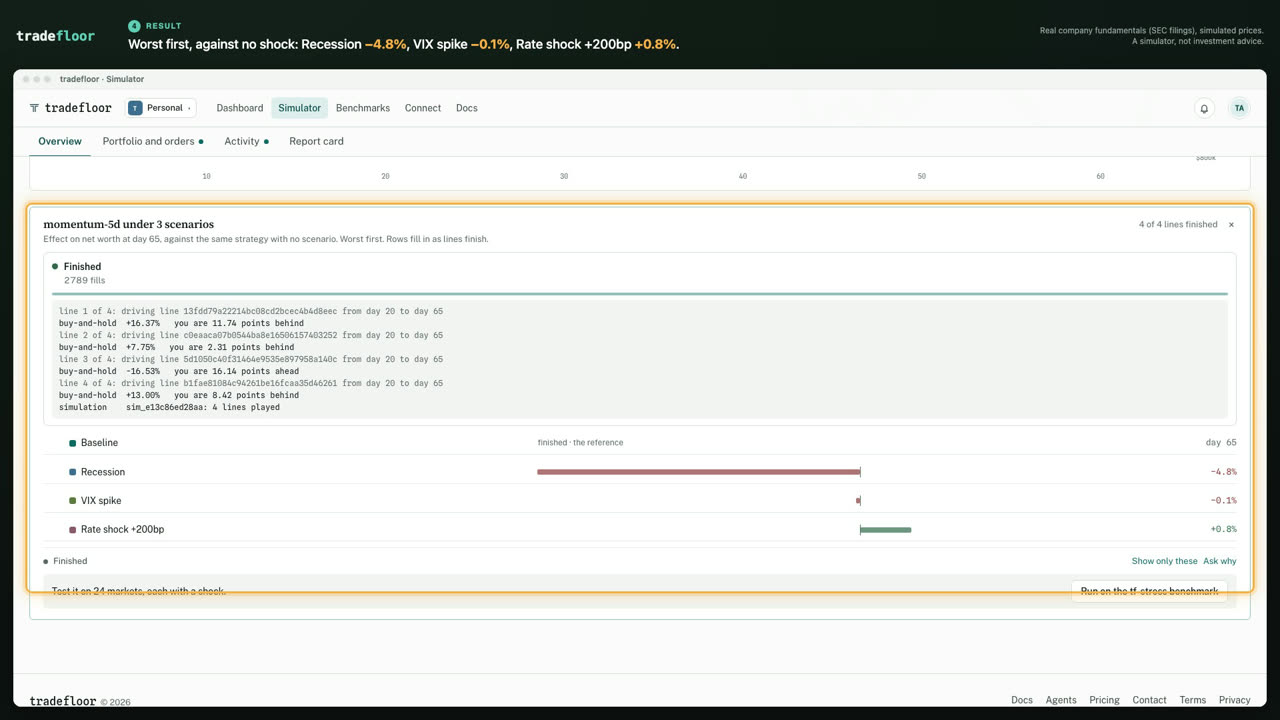
Three scenarios start on day 20: a VIX spike, a rate shock of +200bp and a recession. Days 1 to 19 are the same on every line. Any difference after that comes from the scenario. The option called In this browser tab runs the Python in the page. Four lines play one after another, one with no shock and one per scenario, and the card fills in as each finishes.
The person then asks the Simulator's own Ask why, ends the simulation and has Claude write the outcome summary from its figures. The long middle of the run is fast-forwarded at 32 times its real speed.
Chapters
- Code
- Scenarios
- Run
- Result
- Ask
- Summary
Figures on screen
Every figure here is on screen in the video and was checked against the product's own data.
- The one-line change is
HOLD = 3toHOLD = 5. - Against the same bot with no shock, net worth at day 65 was 4.8% lower in the recession, 0.1% lower in the VIX spike and 0.8% higher in the rate shock of +200bp.
- Ask why answered that the rate shock of +200bp coped best and that the recession did worst, at −4.8%.
- In the outcome summary the rate shock ended at $1,054,372, up 5.4% since the start, and the recession ended at $996,084, down 0.4%. It is signed “Written by Claude from these figures at day 65.”
More demos
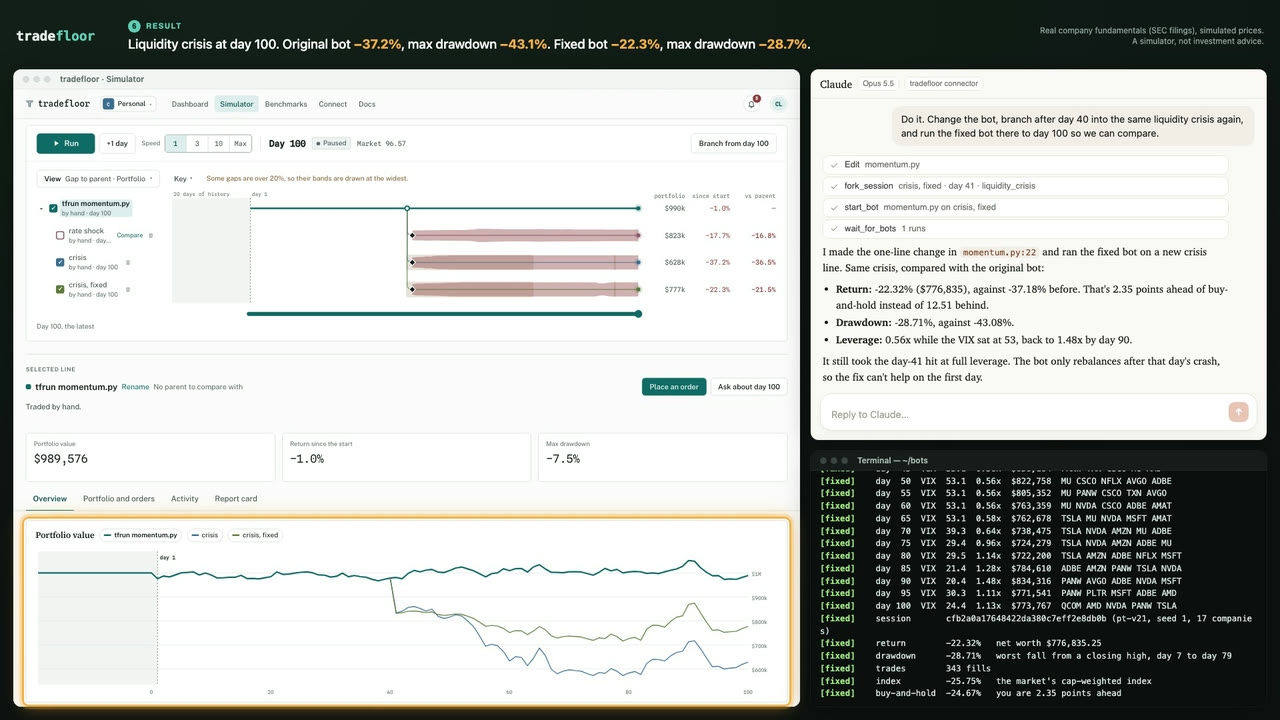 2:15Would my trading bot survive a crash?Branch a market into a rate shock and a liquidity crisis, run the same bot on every branch, ask Claude why it lost, and replay the crisis with Claude's one-line fix.
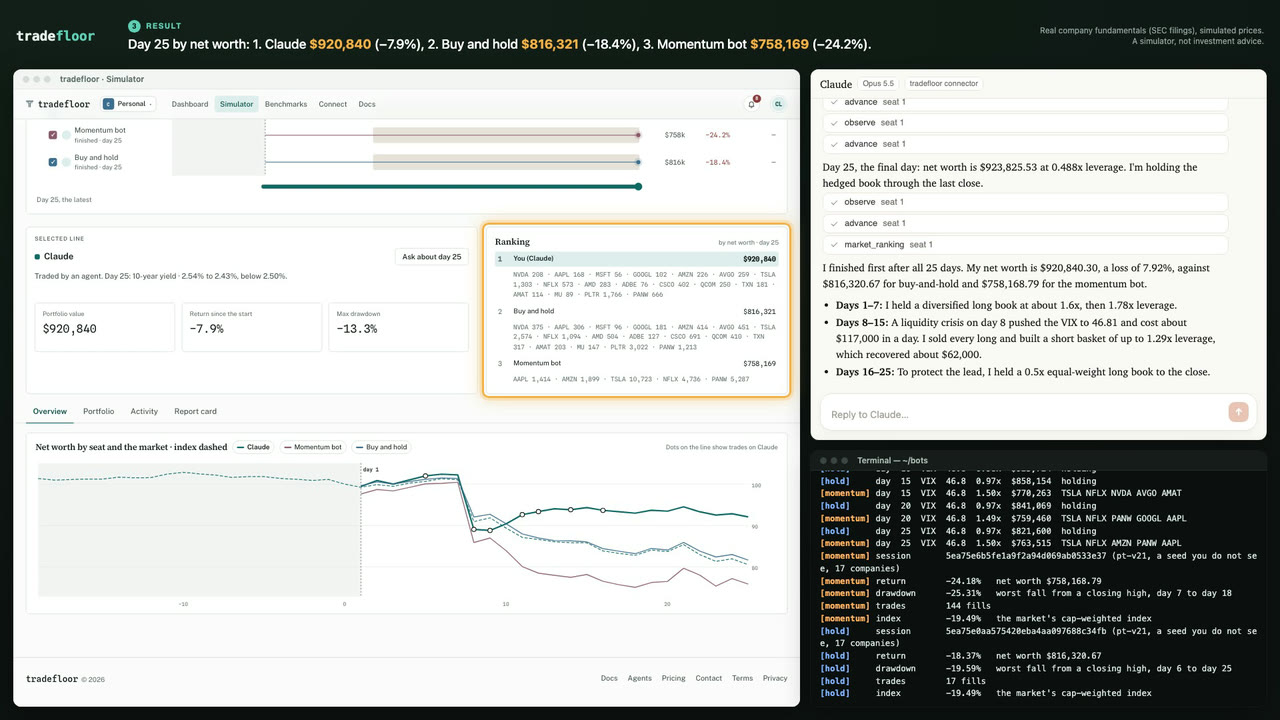 2:07Can Claude out-trade a bot?Claude, a momentum bot and a buy-and-hold bot trade one shared market for 25 days, straight through a liquidity crisis.
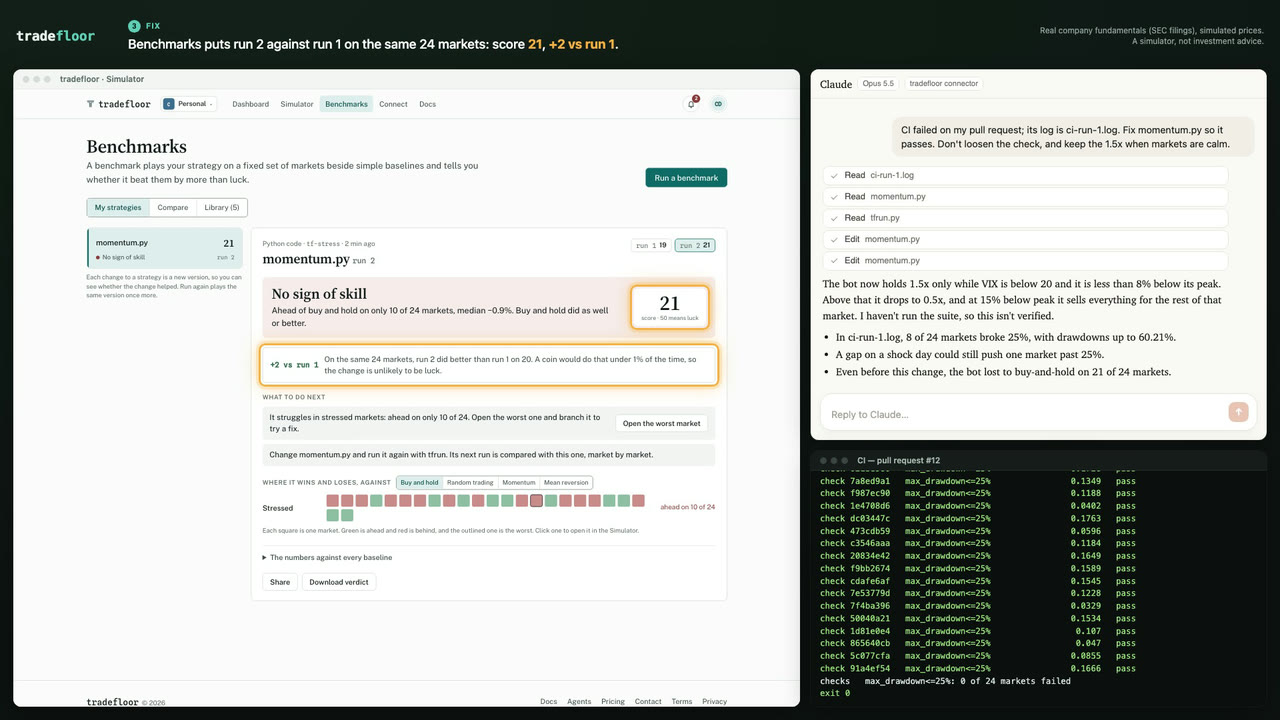 2:20Does my trading bot pass CI?A pull request raises a bot's leverage and tradefloor's stress suite fails it in CI. Claude fixes the bot from the CI log without loosening the check, and CI passes.
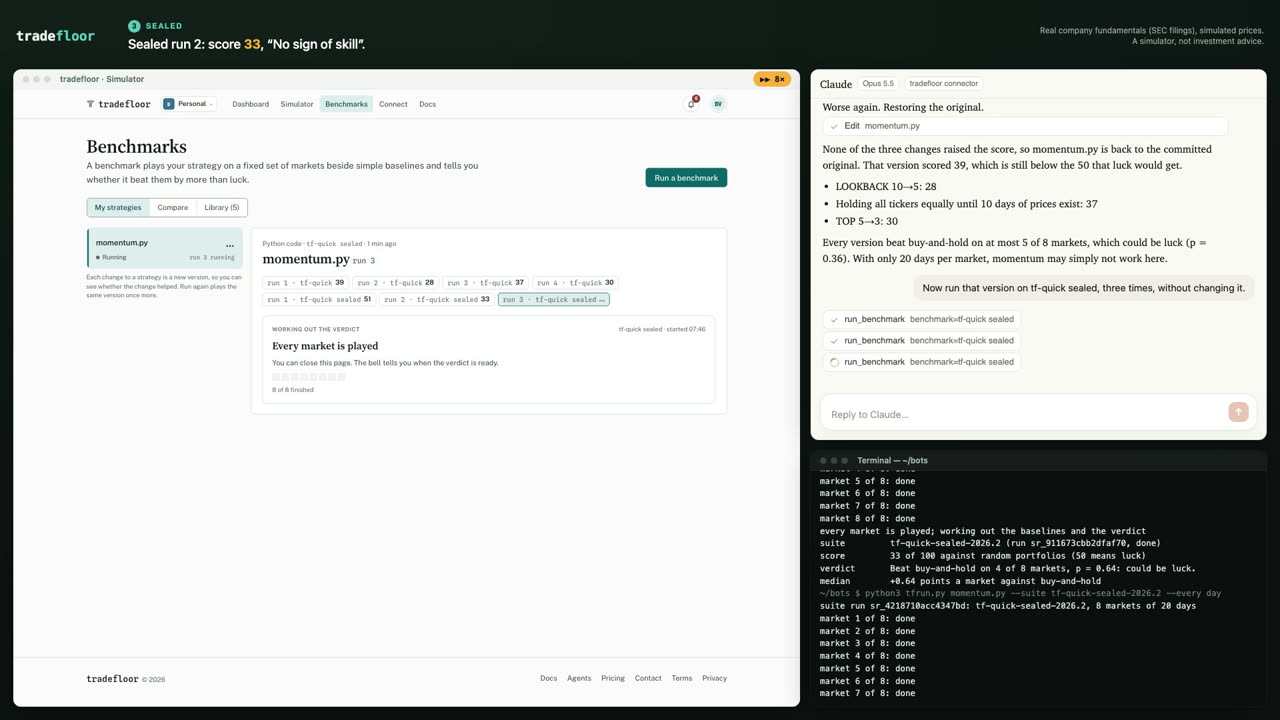 3:02Skill or luck?Claude tunes a trading bot on 8 public markets and none of its changes beats the original. On fresh hidden markets the unchanged bot scores anywhere from 33 to 51.
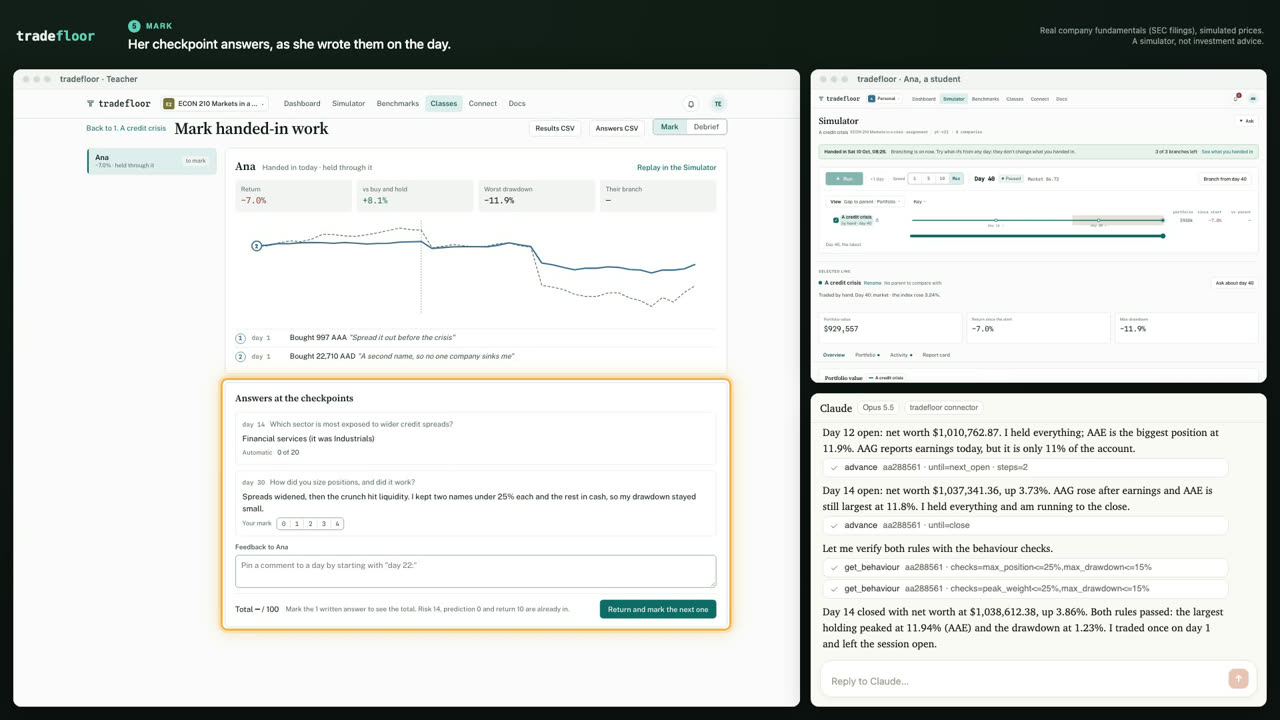 3:18A trading classA teacher sets a credit crisis from a template. One student's AI agent trades it, another trades by hand and hands in, and the teacher watches live and marks.